
Costco Wholesale Corporation (COST) reported a robust financial performance for its fourth quarter of fiscal 2025 with net sales reaching $84.4 billion, an 8% increase from $78.2 billion last year. This growth was supported by strong comparable sales gains across multiple regions and a notable contribution from e-commerce channels.
Comparable sales for the quarter rose 5.7%, reflecting a 5.1% gain in the United States, a 6.3% increase in Canada and a solid 8.6% rise in other international markets. When excluding the impacts of changes in gasoline prices and foreign exchange, total comparable sales rose 6.4%. Canada led with an 8.3% increase, followed by 7.2% growth in other international markets and 6% jump in the U.S market. This highlights Costco’s ability to deliver consistent gains despite currency headwinds and uneven macroeconomic conditions.
E-commerce continued to stand out with comparable sales climbing 13.6% for the quarter, or 13.5% after adjusting for fuel and currency impacts. Momentum was even stronger in August, when the metric surged 18.4%. For the fiscal year, e-commerce comparable sales climbed 15.6%, reinforcing the importance of the company’s investments in omnichannel capabilities.
At quarter-end, Costco operated 914 warehouses globally, including 629 in the United States and Puerto Rico and 110 in Canada, along with a growing presence in markets such as Mexico, Japan and the United Kingdom.
A blend of steady traffic at physical locations, solid international growth and accelerating e-commerce sales powered Costco’s fourth-quarter revenue gains. These factors combined to deliver an 8.1% increase in net sales of $269.9 billion for the fiscal year despite a challenging economic environment.
Walmart and Target’s trends offer industry context
Walmart Inc. (WMT) continued to deliver steady traffic gains with U.S. comparable sales rising 4.6% in the second quarter of fiscal 2026, supported by strength in grocery, health & wellness, and improving trends in general merchandise. E-commerce momentum remained strong as U.S. e-commerce sales advanced 26%, powered by nearly 50% growth in store-fulfilled delivery orders, with roughly one-third completed within three hours.
Target Corporation (TGT) showed early signs of stabilization following a challenging first quarter of fiscal 2025. While second-quarter sales dipped 0.9% year over year, in-store traffic trends improved significantly. Digital performance was also a bright spot, with comparable digital sales growing 4.3%, driven by robust same-day delivery offerings and expanding Drive Up services.
What the latest metrics say about Costco
Costco stock has risen 7.5% over the past year, outpacing the industry’s growth of 6.9%.
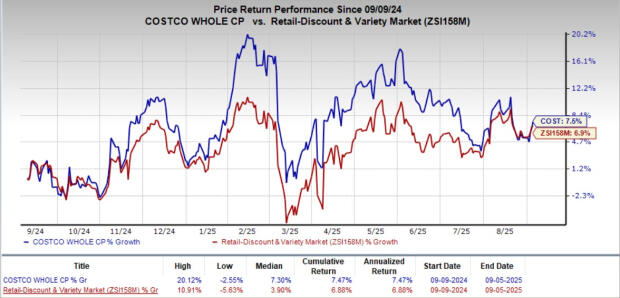
Image Source: Zacks Investment Research
From a valuation standpoint, Costco’s forward 12-month price-to-earnings ratio stands at 48.45, higher than the industry’s ratio of 30.80. COST carries a Value Score of D.
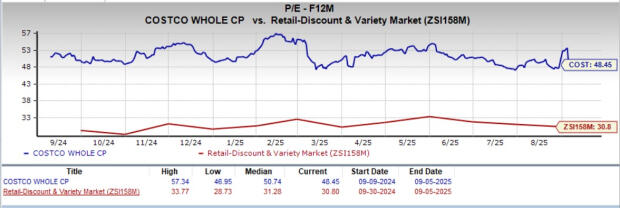
Image Source: Zacks Investment Research
The Zacks Consensus Estimate for Costco’s current financial-year sales and earnings per share implies year-over-year growth of 8.1% and 11.6%, respectively.
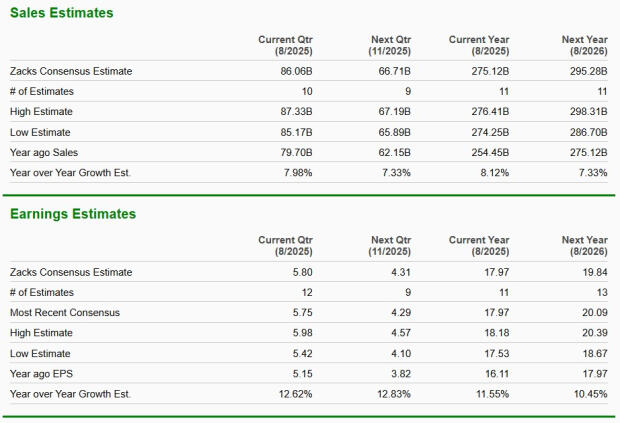
Image Source: Zacks Investment Research
Want the latest recommendations from Zacks Investment Research? Download 7 Best Stocks for the Next 30 Days. Click to get this free report
Past performance is no guarantee of future results. Inherent in any investment is the potential for loss. This material is being provided for informational purposes only and nothing herein constitutes investment, legal, accounting or tax advice, or a recommendation to buy, sell or hold a security. No recommendation or advice is being given as to whether any investment is suitable for a particular investor. It should not be assumed that any investments in securities, companies, sectors or markets identified and described were or will be profitable. All information is current as of the date of herein and is subject to change without notice. Any views or opinions expressed may not reflect those of the firm as a whole. Zacks Investment Research does not engage in investment banking, market making or asset management activities of any securities. These returns are from hypothetical portfolios consisting of stocks with Zacks Rank = 1 that were rebalanced monthly with zero transaction costs. These are not the returns of actual portfolios of stocks. The S&P 500 is an unmanaged index. Visit https://www.zacks.com/performance for information about the performance numbers displayed.
