- TRV stock soars 8% on Thursday after delivering record Q3 earnings.
- Travelers adjusted EPS spiked 169% from a year earlier.
- Record underlying underwriting income led to the successful quarter.
- TRV stock could run up to $280 based on technical chart pattern.
The Travelers Companies (TRV) stock has popped 8% on Thursday after its third-quarter earnings surprised to the upside. Underwriting margins were much better than a year ago, leading to record underlying underwriting income of $1.5 billion, and the insurance company benefited from improvement in its investment portfolio as well.
Travelers stock gains helped the Dow Jones Industrial Average (DJIA), of which it is a member, climb to a new all-time high of 43,289. This daily gain eclipsed both the NASDAQ and S&P 500.
Better US Retail Sales data, as well as lower Initial Jobless Claims than expected, worked in concert to help US equity markets. Additionally, impressive figures from Taiwan Semiconductor (TSM) earnings and an improved 2025 outlook have fortified expectations that the artificial intelligence (AI) rally has legs to continue building.
Travelers stock news: Q3 earnings surprise
Travelers reported adjusted EPS that was a whopping 46% above Wall Street consensus. Expected at $3.59, the figure arrived at $5.24. Net earned premiums of $10.7 billion, which is partially a stand-in for revenue, rose 10% YoY and was $130 million ahead of consensus.
To put this in better context, adjusted EPS popped 169% from a year prior, when the company earned $1.95.
“Both underwriting income and underlying margins were strong in all three of our segments,” said CEO and Chairman Alan Schnitzer on the earnings call. “The underlying combined ratio in our Business Insurance segment improved nearly 2 points to an excellent 87.9%. And our Bond & Specialty business delivered a very strong underlying combined ratio of 85.6%. The underlying combined ratio in Personal Insurance improved 11.5 points to an exceptional 82.7%. These terrific segment results contributed to a reported consolidated combined ratio that improved nearly 8 points to 93.2%.”
The margins improved despite the fact that catastrophe losses rose from $850 million in the prior year’s period to $939 million. Both figures are on a pre-tax basis.
Book value rose 39% YoY to $122 per share, and this was aided by the Federal Reserve’s recent decision to begin trimming interest rates. Lower expected interest rates raise the value of future investment income.
Better yields on its fixed-income portfolio and improved payouts from its private equity investments contributed to $742 million in net investment income. This figure rose 3% from the previous quarter and 16% from a year earlier.
Travelers stock forecast: Bull flag pattern leads to $280 target
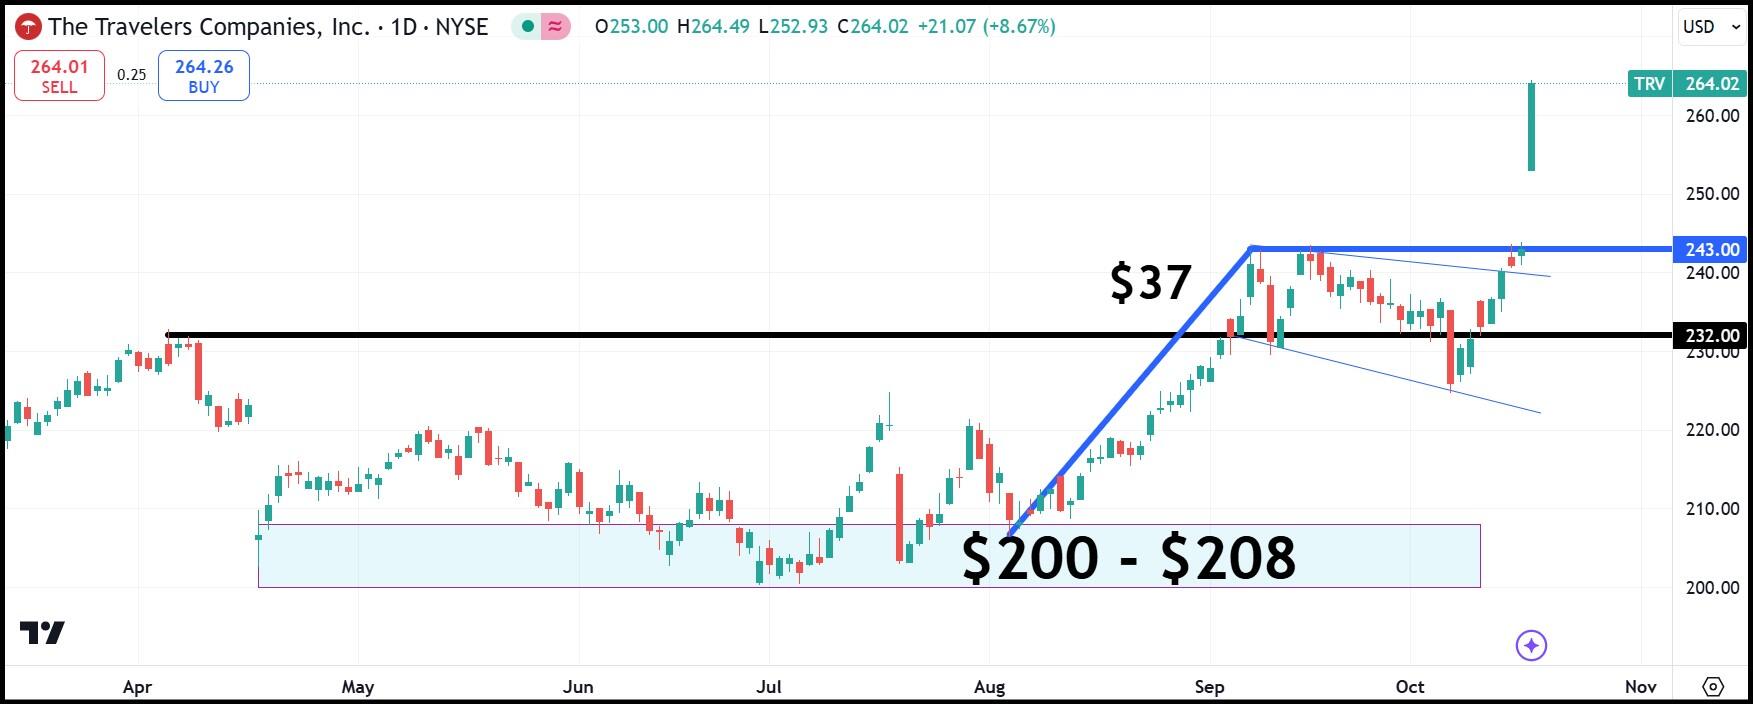
Travelers stock probably has more room to run. TRV shares have recently been trading in what amounts to a bull flag pattern on the daily chart.
The length of the pole in the bull flag is $37, running from $206 on August 5 to $243 on September 9. Adding that $37 to the top resistance on the flag of $243, well get an expected breakout rally running to $280.
This means that despite TRV stock’s impressive rally on Thursday, bulls should expect another 6% gain above the intraday share price of $264 before taking profits.
TRV daily stock chart
Information on these pages contains forward-looking statements that involve risks and uncertainties. Markets and instruments profiled on this page are for informational purposes only and should not in any way come across as a recommendation to buy or sell in these assets. You should do your own thorough research before making any investment decisions. FXStreet does not in any way guarantee that this information is free from mistakes, errors, or material misstatements. It also does not guarantee that this information is of a timely nature. Investing in Open Markets involves a great deal of risk, including the loss of all or a portion of your investment, as well as emotional distress. All risks, losses and costs associated with investing, including total loss of principal, are your responsibility. The views and opinions expressed in this article are those of the authors and do not necessarily reflect the official policy or position of FXStreet nor its advertisers. The author will not be held responsible for information that is found at the end of links posted on this page.
If not otherwise explicitly mentioned in the body of the article, at the time of writing, the author has no position in any stock mentioned in this article and no business relationship with any company mentioned. The author has not received compensation for writing this article, other than from FXStreet.
FXStreet and the author do not provide personalized recommendations. The author makes no representations as to the accuracy, completeness, or suitability of this information. FXStreet and the author will not be liable for any errors, omissions or any losses, injuries or damages arising from this information and its display or use. Errors and omissions excepted.
The author and FXStreet are not registered investment advisors and nothing in this article is intended to be investment advice.


